When planning a sailing holiday, choosing the itinerary, the bays where to anchor, and the daily stops largely depends on weather conditions. Today, numerous apps allow sailors to quickly check wind, sea state, and rainfall forecasts. However, anyone who truly wants to understand how the weather will evolve should learn to use a tool that has long accompanied sailors and maritime professionals: the synoptic chart. Synoptic charts provide an overview of the entire weather situation, making it possible to understand how the main atmospheric systems are moving and how they will influence navigation over the coming days. This is a significant advantage, especially when sailing in areas where the wind can change rapidly in both strength and direction.
Why Look Beyond the Standard Weather Forecast
When preparing for a week of sailing, it is natural to focus on the weather forecast for the area where you will be cruising. However, the conditions you encounter at sea are often determined by weather systems that develop far from your current location. A low-pressure system forming over the Gulf of Lion can influence Northern Sardinia and Southern Corsica within just a few hours. A cold front moving south from continental Europe can alter conditions across the Tuscan Archipelago or along the Amalfi Coast. Likewise, in the Caribbean, the evolution of the trade winds and tropical systems can affect vast areas stretching from the Windward Islands to the Leeward Islands. Synoptic charts allow sailors to observe these weather systems as they develop, providing a much broader perspective than a simple local forecast.

What Are Synoptic Charts?
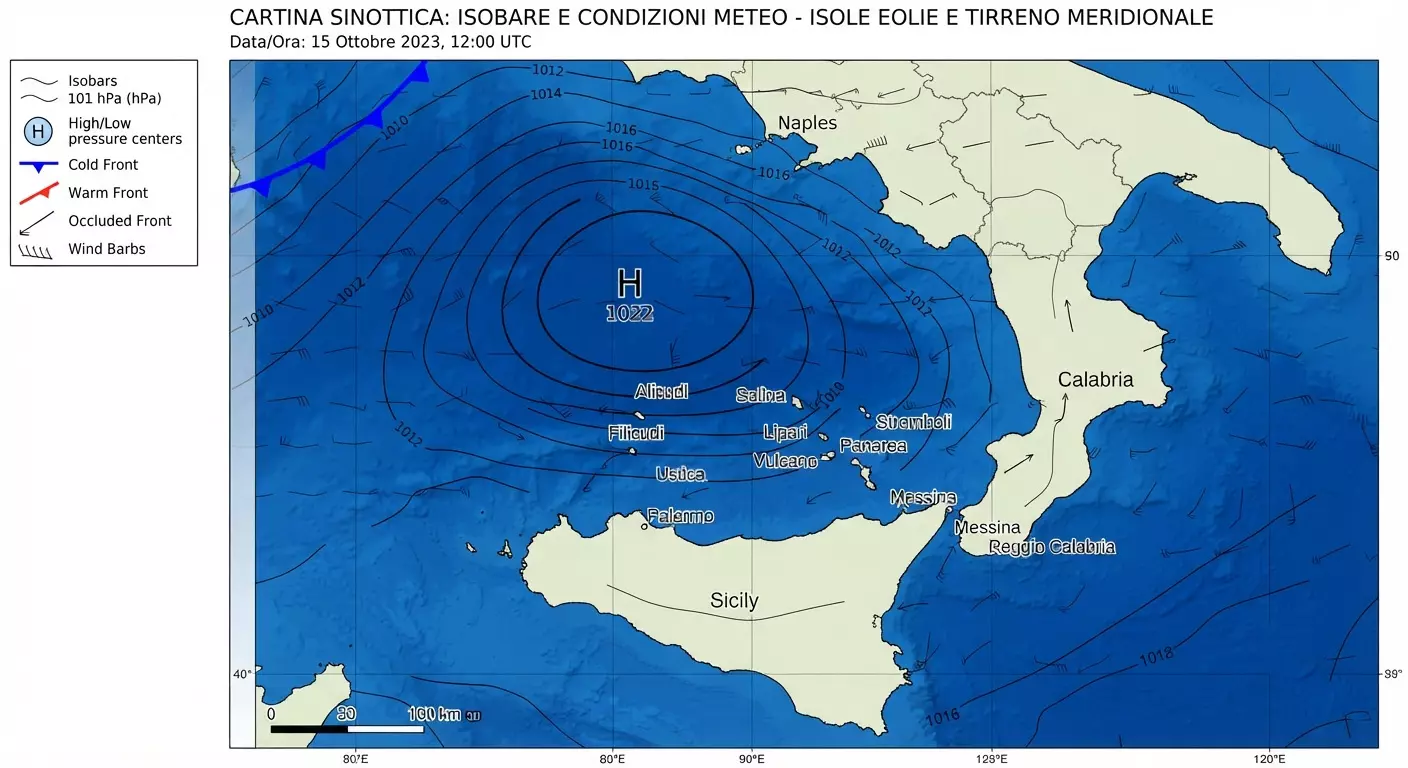
A synoptic chart is a graphical representation of the state of the atmosphere over a large geographical area at a specific moment in time. Using standardized lines, symbols, and weather indicators, it shows the location of high- and low-pressure systems, the pattern of isobars, atmospheric fronts, and the main weather dynamics affecting conditions. The word "synoptic" literally means "providing an overall view," and that is precisely what makes these charts so valuable for sailors: they help explain not only what the weather will be, but also why conditions are changing.
The Main Elements to Understand
You do not need to be a professional meteorologist to interpret a synoptic chart. Understanding a few key elements is enough to gain highly valuable information.
Isobars
Isobars are lines connecting points with the same atmospheric pressure. When they are closely spaced, they generally indicate stronger winds, while wider spacing usually suggests calmer conditions. For a skipper, isobars provide an immediate indication of the expected wind strength.
High and Low Pressure Systems
High-pressure systems are typically associated with stable weather, calmer seas, and moderate winds. Low-pressure systems, on the other hand, are often linked to atmospheric instability, increasing cloud cover, rainfall, and stronger winds. Observing the movement of these systems allows sailors to anticipate weather changes along their route.
Weather Fronts
Weather fronts mark the boundary between different air masses. A cold front can bring stronger winds and sudden thunderstorms, while a warm front is generally associated with a more gradual deterioration in weather conditions. For sailors, recognizing these fronts provides valuable insight into how the weather is likely to evolve over the following hours.

Synoptic Charts and Yacht Charter: Practical Examples
Every sailing destination has its own weather characteristics. Synoptic charts help sailors interpret these conditions and plan their cruises with greater confidence.
Northern Sardinia and Southern Corsica
Between the La Maddalena Archipelago, Bonifacio, and the southern coast of Corsica, the wind is often influenced by the Mistral blowing from France. By examining a synoptic chart, sailors can identify the approach of a low-pressure system over the Gulf of Lion and assess the expected increase in wind strength over the coming days. This information can be crucial when selecting the most sheltered anchorages or planning crossings between Sardinia and Corsica.
Aeolian Islands
The Aeolian Islands are one of the Mediterranean's most fascinating sailing destinations, but also one of the most sensitive to changing wind conditions. Synoptic charts make it possible to monitor the evolution of high- and low-pressure systems over the Tyrrhenian Sea and the Strait of Sicily, providing valuable guidance for planning passages between Lipari, Salina, Panarea, Stromboli, and Vulcano.
Tuscan Archipelago
Weather conditions around Elba, Capraia, and the other islands of the Tuscan Archipelago can change rapidly when disturbances approach from the Ligurian Sea or the Gulf of Lion. Careful analysis of synoptic charts helps sailors anticipate strengthening Mistral or Libeccio winds, allowing them to plan their routes more safely.
Amalfi Coast
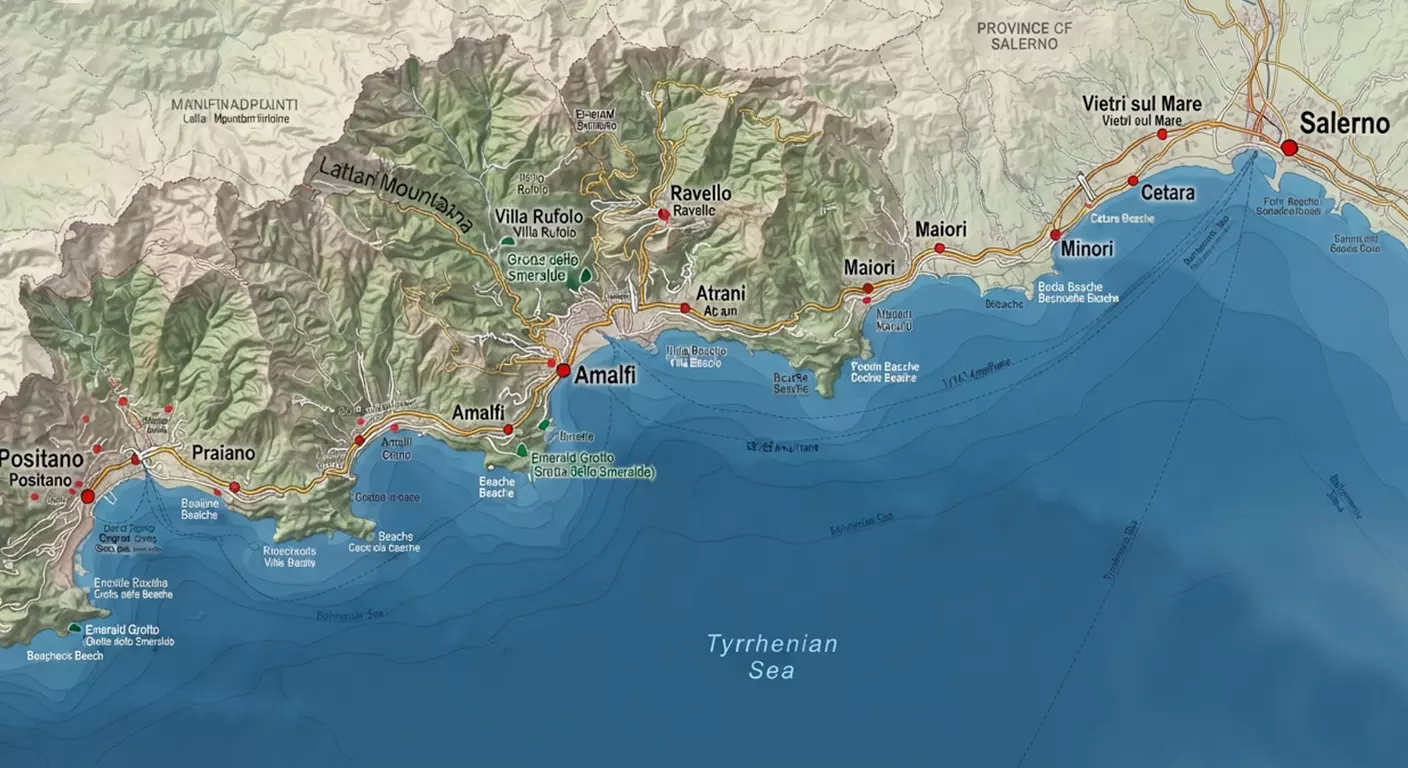
The combination of thermal breezes and the rugged coastal landscape makes the Amalfi Coast particularly interesting from a meteorological perspective. Although conditions often appear favorable, weather systems moving across the Tyrrhenian Sea can quickly alter the overall situation. Synoptic charts help identify these changes in advance, making it easier to plan sailing legs and overnight stops with greater confidence.
Leeward Islands
In the Northern Caribbean, the Leeward Islands generally enjoy stable sailing conditions thanks to the trade winds, which blow consistently throughout most of the year. However, synoptic charts allow sailors to monitor tropical waves, changes in the trade wind pattern, and weather systems that could affect navigation between the islands.
Windward Islands
Further south, the Windward Islands are among the most popular destinations for catamaran and sailing holidays. Here too, consulting synoptic charts helps sailors understand the evolution of the prevailing winds and plan passages and anchorages according to the expected conditions over the following days.
Where to Find Synoptic Charts
Today, synoptic charts are readily available online and are updated several times a day by the world's leading meteorological agencies. Among the most reliable sources are MeteoAM, the Italian Air Force Meteorological Service, the UK Met Office, and Météo-France, all of which regularly publish detailed weather analyses and forecasts. Many sailing weather platforms also combine these charts with wind and wave models, giving skippers a comprehensive overview of expected conditions.
A Small Habit That Can Improve Your Sailing Holiday
Before setting sail, spending just a few minutes examining a synoptic chart can make a significant difference. It is not simply about checking whether the forecast calls for sunshine or rain, but about understanding how the wind and sea conditions are likely to evolve throughout your entire itinerary. Whether you are sailing through the crystal-clear waters of Northern Sardinia and Corsica, exploring the volcanic Aeolian Islands, cruising the Tuscan Archipelago, discovering the Amalfi Coast, or island-hopping across the Caribbean, understanding the broader weather picture allows you to enjoy your sailing holiday with greater confidence, safety, and freedom. After all, a sailing vacation is even more enjoyable when you know how to read the signs in the sky.
Contact us on WhatsApp: